
A network that quotes a $12 CPM can pay you less than one that quotes $6. The gap closes through four mechanisms most publishers never model: revenue share, fill rate, payment terms and demand quality. When we evaluate a partner at WireAds, we look at the net revenue that lands in the bank account after 60 days, not the number a salesperson puts in a slide deck. This article walks through the exact evaluation process we recommend to any publisher comparing publisher monetization offers, with the math you can run yourself before you sign anything.
Why the headline CPM is the least useful number in the offer
The quoted CPM is a gross figure before several deductions, and often it is not even a real average. Networks quote the CPM of their best-performing geo, format or hour of the day. A "$15 CPM" offer might describe a single US video placement while your traffic is 60% EU display, which clears at a fraction of that rate. Ask any network for the CPM broken down by geo, format and device, weighted by your actual traffic mix, and the number usually shrinks.
The second problem is that gross CPM ignores the revenue share. Some networks keep 20% of spend, others keep 50%, and a few bury their cut inside a "technology fee" or "operating fee" that never appears in the offer email. Two networks quoting identical gross CPMs can therefore differ by 40% in net payout. The only comparable figure is net eCPM: the money credited to your account divided by your thousand impressions, after every fee.
The third problem is timing. A CPM earned in January and paid in April has financed the network's operations for 90 days with your money. Payment terms carry a real cost, and publishers who ignore them systematically overvalue offers with slow terms. We pay Net 30 because we think publishers should not act as free credit lines for their demand partners, and because the comparison is only honest when you price the waiting.
The five numbers that actually determine your payout
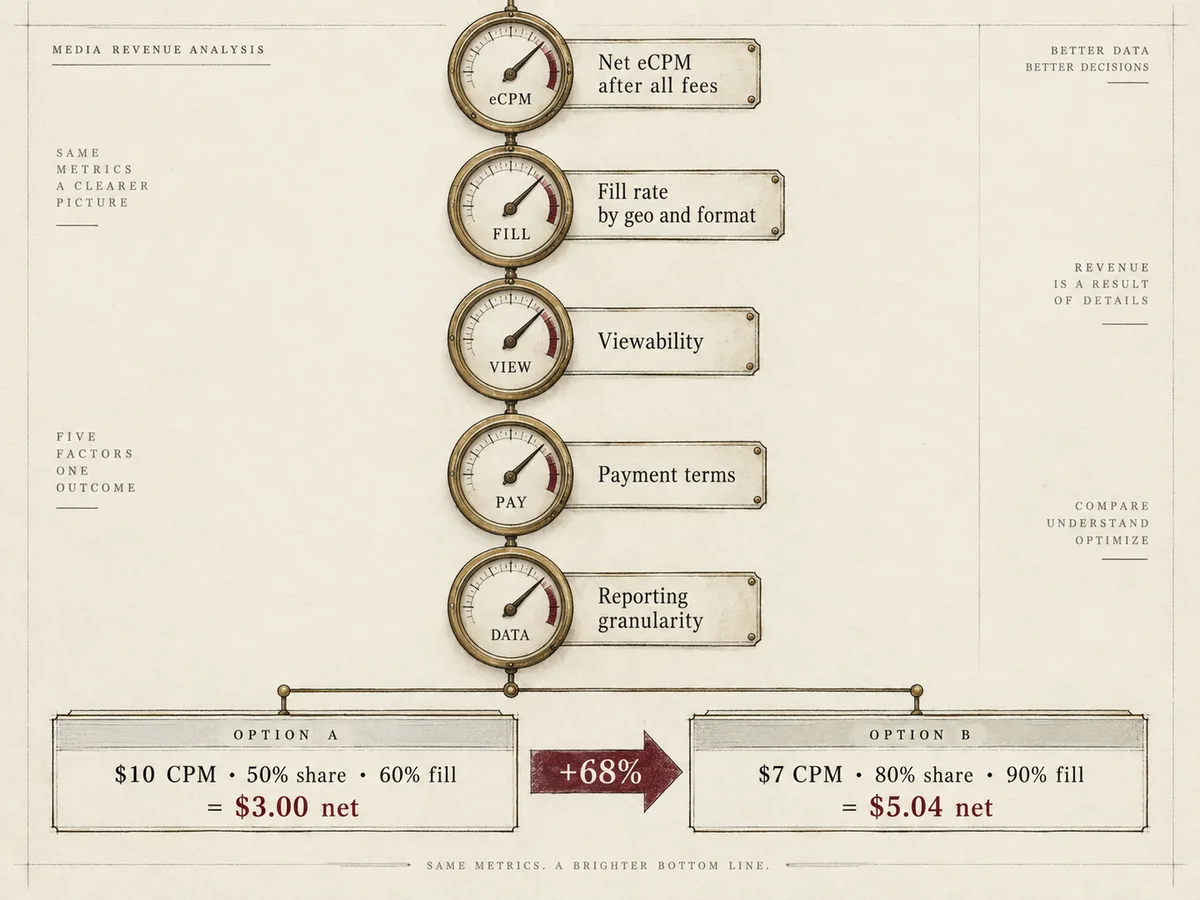
Gross CPM is one input. Here are the five that decide the outcome.
Net eCPM after all fees. Take the gross CPM, subtract the network's revenue share, and subtract any additional fees listed in the contract. The AdSense AdSense revenue share benchmark gives you a useful reference point: publishers keep about 68% when advertisers buy through Google Ads, and 80% after advertiser platform fees. If a network's effective share is materially worse than that, the gross CPM has to be dramatically higher to compensate.
Fill rate by geo and format. A network with a 95% fill rate on US traffic and a 30% fill rate on your EU traffic produces a blended yield far below the quoted CPM. Always ask for fill rate on your specific traffic profile, not the network average.
Viewability and session impact. Low-quality demand fills impressions below the fold or in placements users never see. The impressions count, the CPM gets paid, and the demand quality collapses because advertisers bid less on inventory with poor viewability. Over a quarter, this quietly drags every auction down.
Payment terms and minimum payout thresholds. Net 30 versus Net 90 is a working capital question. A threshold of $100 that you reach every two months effectively adds another month of waiting on a portion of your revenue.
Reporting granularity. If you cannot see revenue by page, geo and device daily, you cannot diagnose problems, and you cannot verify anything the account manager tells you.
Multiply these together and you get the real comparison. A $10 gross CPM with a 50% share and 60% fill yields $3.00 net per thousand available impressions. A $7 gross CPM with an 80% share and 90% fill yields $5.04. The "worse" network pays 68% more.
Payment terms and the working capital cost of slow networks
Payment terms deserve their own calculation because publishers routinely leave 2 to 5% of annual revenue on the table by ignoring them. Money you receive 90 days late is money you cannot deploy: not into content, not into traffic, not into paying your own suppliers. If your site earns $10,000 per month and a network holds Net 90 terms, you have $30,000 of your own revenue outstanding at any moment. At a conservative 8% annual cost of capital, that waiting costs you $2,000 per year, or 1.7% of revenue, before you account for the risk that the network never pays at all.
Slow terms also correlate with financial fragility. Networks that pay Net 60 or Net 90 often do so because they are financing their own operations on publisher revenue. When a network like that hits a cash crunch, publishers sit at the back of the creditor line. We have seen this pattern repeat across the industry, and it is why we hold Net 30 as a fixed term rather than a negotiating chip: a publisher should be able to plan payroll and infrastructure costs on a predictable schedule.
When you compare offers, normalize for terms. A Net 90 payment is worth roughly 1 to 2% less than the same amount paid Net 30, purely on the time value of money, and more once you price default risk. Ask three questions before signing: the exact payment trigger date, the payout method and its fees, and what happens to unpaid balances if either party terminates the agreement.
Demand quality and what it does to effective CPM
The composition of a network's demand determines whether your CPM rises or decays over two quarters. Open market demand from exchanges gives you reach and baseline fill, but it also brings the widest spread of advertiser quality. Premium demand from direct brand deals bids higher, sustains longer campaigns, and does not burn your users with aggressive creatives. A network that layers direct deals on top of open auction demand consistently outperforms a network with open auction alone, because the direct campaigns set a higher floor in every auction.
This is a core part of how we build our own stack: we combine Prebid, OpenRTB, Google MCM and Google AdX demand with Direct Deals demand from global and local brand agencies, so all sources bid against each other on every impression. The mechanism matters more than the brand names. When a direct deal bids $9 into an auction where open market demand would have paid $4, the publisher captures the difference, and the advertiser gets the reach it contracted for.
Demand quality also shows up in user metrics. Heavy, low-quality demand increases bounce rate, shortens sessions and degrades return visits, which lowers the value of every future impression. Check a prospective network's creative standards: do they filter redirect ads, auto-play audio, fake close buttons and malware-laced creatives? We apply strict filtering precisely because a single bad creative can cost more in lost audience than it pays in CPM.
Transparency signals you can check before signing
You do not have to trust a network's claims; you can verify several of them in under an hour using public infrastructure.
Start with ads.txt and app-ads.txt. Every authorized seller of your inventory should appear in your file, and the network should give you its own lines to publish. If a network resists adding itself to your ads.txt, treat that as a disqualifying signal, because unauthorized reselling is exactly what the file exists to prevent.
Next, pull the network's sellers.json and check its entry for your account. The IAB Tech Lab lets you verify direct seller status with a simple lookup: sellers.json reveals whether a network acts as a direct seller or a reseller for your inventory. A network that marks itself as a direct seller when it actually resells your impressions is misrepresenting the supply chain to buyers, and buyers respond by bidding lower or skipping your inventory entirely.
Then check the SupplyChain object. When your impressions reach a DSP, the SupplyChain object records every hop the request took. Chains with three or four intermediaries each take a margin, and the buyer discounts the bid accordingly. Short chains with honest roles pay more, which is one reason we keep our supply path as direct as our demand allows.
Finally, ask for a sample of the network's sellers.json, a screenshot of their reporting dashboard with real data, and the name of the Google MCM relationship if they claim managed partner status. A network with nothing to hide produces all three in a day.
Fill rate, viewability and the math of combined yield
Fill rate and CPM trade off against each other, and naive optimization of either one loses money. A network that guarantees 100% fill often does it with low-floor default demand that pays $0.10 CPM on the impressions your premium demand would have won at $4.00. Conversely, a network that chases only premium demand leaves 30% of your impressions unsold. The correct target is maximum combined yield: fill rate times net eCPM, measured across all available impressions.
Run the calculation per segment, not in aggregate. US desktop video, EU mobile display and APAC in-app each behave differently, and a single blended number hides the segments where a network underperforms. Our CPM to revenue calculator lets you model this directly: enter gross CPM, revenue share, fill rate and traffic by segment, and compare two offers on net revenue rather than on the quote.
Viewability belongs in the same equation. If a network's demand wins impressions in a placement with 35% viewability, advertisers will discount those bids in the next campaign, and the CPM decays even though your traffic stays constant. Ask networks for the average viewability of their filled impressions and compare it against your own analytics. A gap of more than a few points means the network fills placements your better demand ignores.
How to run an honest head-to-head test
Claims lose to tests. Before you commit your inventory, run a controlled comparison, and structure it so neither network can game the result.
Split by user, not by page. Randomize at the user level with a persistent key so the same user always sees the same network; otherwise cookie-based frequency caps and user-level demand give one side an artificial advantage. Run the test for at least 30 days to cover weekly campaign cycles and month-end budget flushes. Cap it at 60 days, because beyond that, seasonality confuses the read.
Measure net revenue per thousand sessions, not per thousand impressions. Sessions capture the session-depth effects of demand quality: heavy ads shorten sessions, and fewer impressions per session lower total revenue even when per-impression CPM looks identical. Also record bounce rate, pages per session and return rate on each arm, because a network that wins on CPM while losing 10% of your sessions may still lose overall.
Demand the raw numbers, not a summary. You want daily revenue, impressions, fill rate and net eCPM per arm, in a format you can put in a spreadsheet. A network that refuses to export its own test data is telling you something about its reporting culture.
Red flags in network contracts
Some terms reveal a network's real economics more honestly than any sales call. Watch for these.
Perpetual exclusivity. A network that demands exclusive access to your inventory, at any CPM, removes your ability to test alternatives and removes its own incentive to perform. Exclusivity should come with a premium and an end date, or not at all.
Unilateral CPM changes. Contracts that let the network revise rates "at any time with notice" convert your quoted CPM into a temporary promotional number. Insist on rate stability windows of at least 90 days.
Clawbacks without definition. Legitimate networks adjust for invalid traffic and confirmed fraud, and they should define the methodology. Undefined clawback rights let a network retroactively reduce any month's payment.
Payment terms tied to thresholds. If the contract raises the payout threshold or extends terms when your revenue dips, you carry more risk exactly when you can least afford it.
No termination-for-cause payment guarantee. When you terminate, the contract must state when outstanding revenue gets paid. Anything vague here has cost publishers real money.
A network confident in its performance accepts clear terms, because clear terms reduce churn among good publishers. We publish our terms, we pay Net 30, and we would rather win a head-to-head test on net revenue than win a negotiation on a gross CPM quote. Hold every network you evaluate to that standard, and the offers that survive the math will be the ones worth signing.