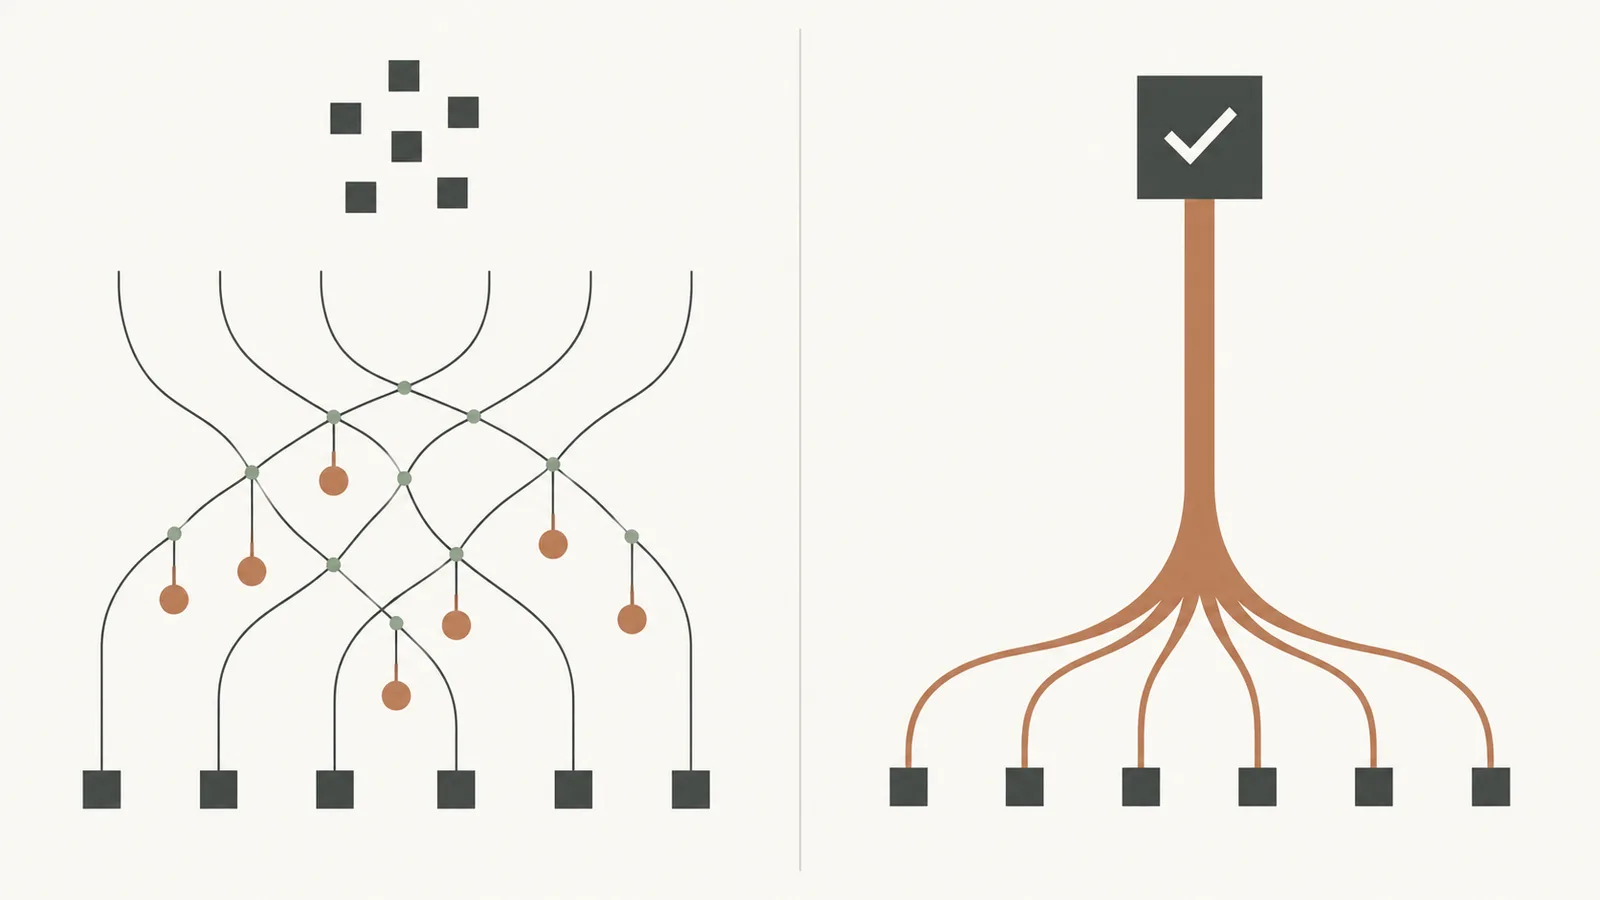
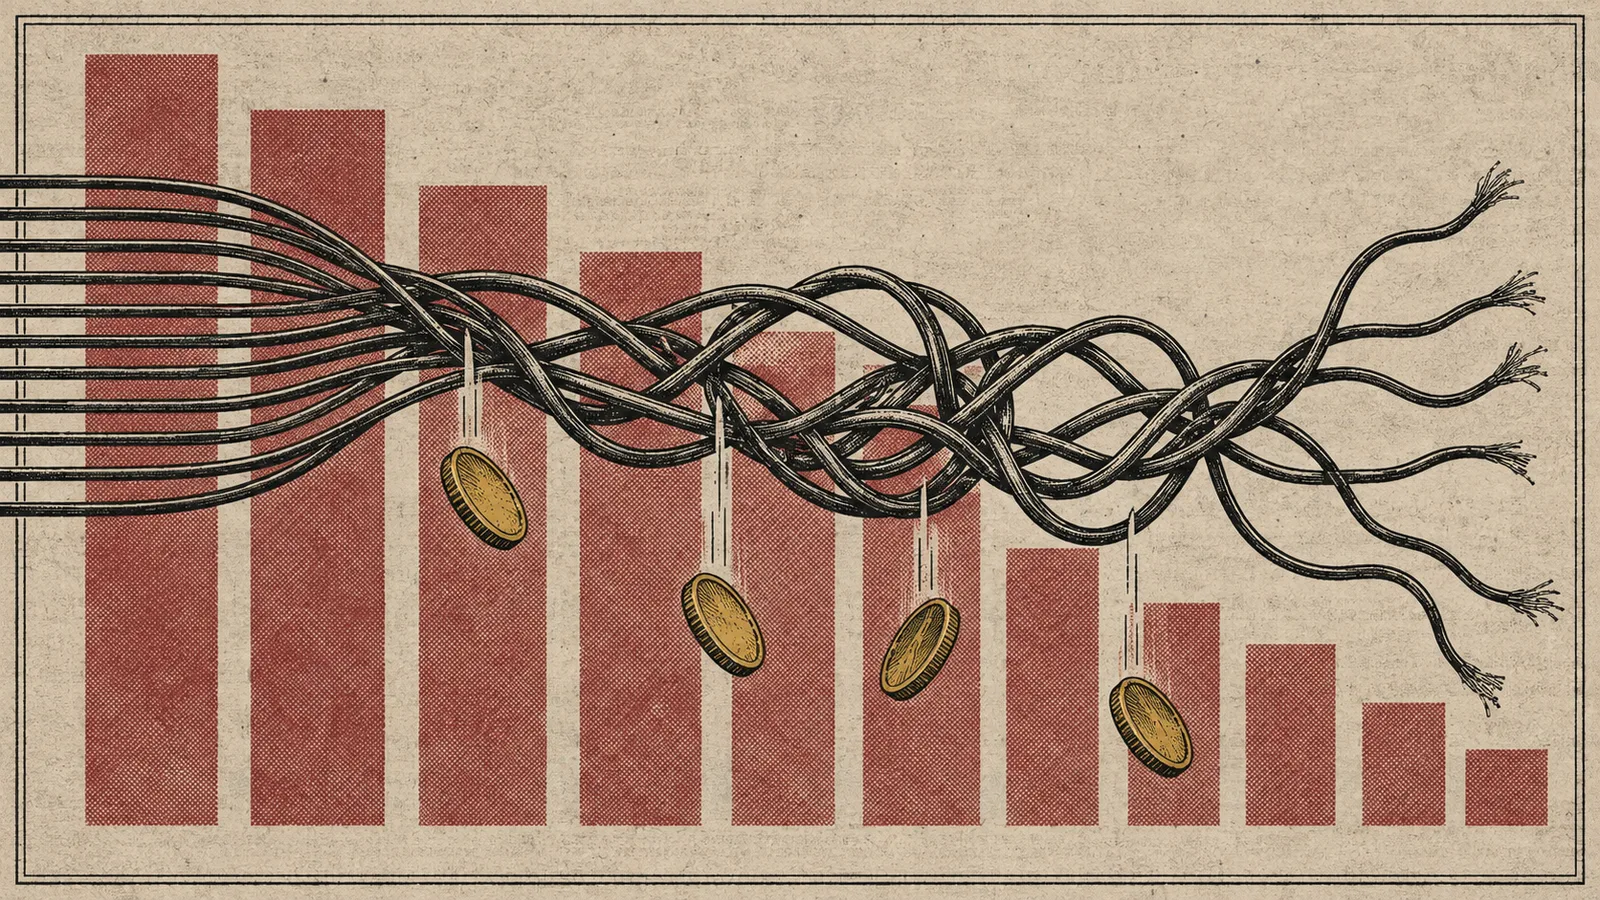
A publisher that loads nine demand partners into a header bidding wrapper rarely earns nine times the revenue. In practice, the fifth through ninth partners add single-digit bid density while each one adds latency, a payment relationship, a reporting line and a reseller cut. The economics of ad network sprawl look acceptable on the bid log and fall apart on the net revenue line. We work with publisher setups across web, app and CTV through our SSP, and the accounts that scale fastest share one trait: they run a small number of partners, chosen deliberately, and they prune the rest. This article breaks down the real costs of running too many networks and explains why we recommend two to four partners, with the best network assigned to each banner type.
Why publishers stack networks in the first place
Sprawl starts with a reasonable instinct: every unfilled impression is lost revenue, so more demand sources should mean more fill. When a network sales rep claims exclusive brand budgets, the safe answer feels like yes. When a test partner lifts one placement's CPM by 8 percent for two weeks, the partner stays on the page long after the effect fades.
Three mechanisms keep the stack growing. First, each network reports its own numbers, so the marginal partner always looks additive from its own dashboard, even when it mostly re-bids demand another partner already sends. Second, publishers fear removing a partner will drop fill on a thin placement, and almost nobody runs a clean holdout test to check. Third, nobody owns the cost side: latency, payment terms and maintenance never appear in the same report as CPM, so the ledger only shows the upside.
The result is a wrapper that accumulates partners the way a garage accumulates tools. Six of them do overlapping work, and the publisher pays for all six in ways the dashboards never itemize.
Latency is a revenue cost, not a UX line item
Every bidder you add to a Prebid.js wrapper ships additional JavaScript, fires an OpenRTB request from the user's browser and waits for a response before the auction can resolve. A typical auction timeout runs between 800 and 1500 milliseconds. With nine bidders, the auction completes only as fast as the slowest meaningful response, and slow bidders either delay the auction for everyone or lose on timeout, in which case they contribute nothing except page weight.
Latency hits revenue through two channels. The first is bid quality: partners with slow infrastructure get their bids discarded, so the effective competition is smaller than the configured partner count. The second is viewability: ads that render late below the fold get measured as low viewability, and viewability is a direct input into what advertisers will pay through most exchanges. Advertisers filter or discount placements that render after the user has scrolled past.
The effect is measurable and large. When the German publisher Netzwelt rebuilt its site around performance, a Core Web Vitals boost ad revenue case study documented an 18 percent ad revenue increase with viewability above 75 percent, purely from faster rendering. That single optimization outperformed what most publishers gain from their fourth through ninth demand partners combined.
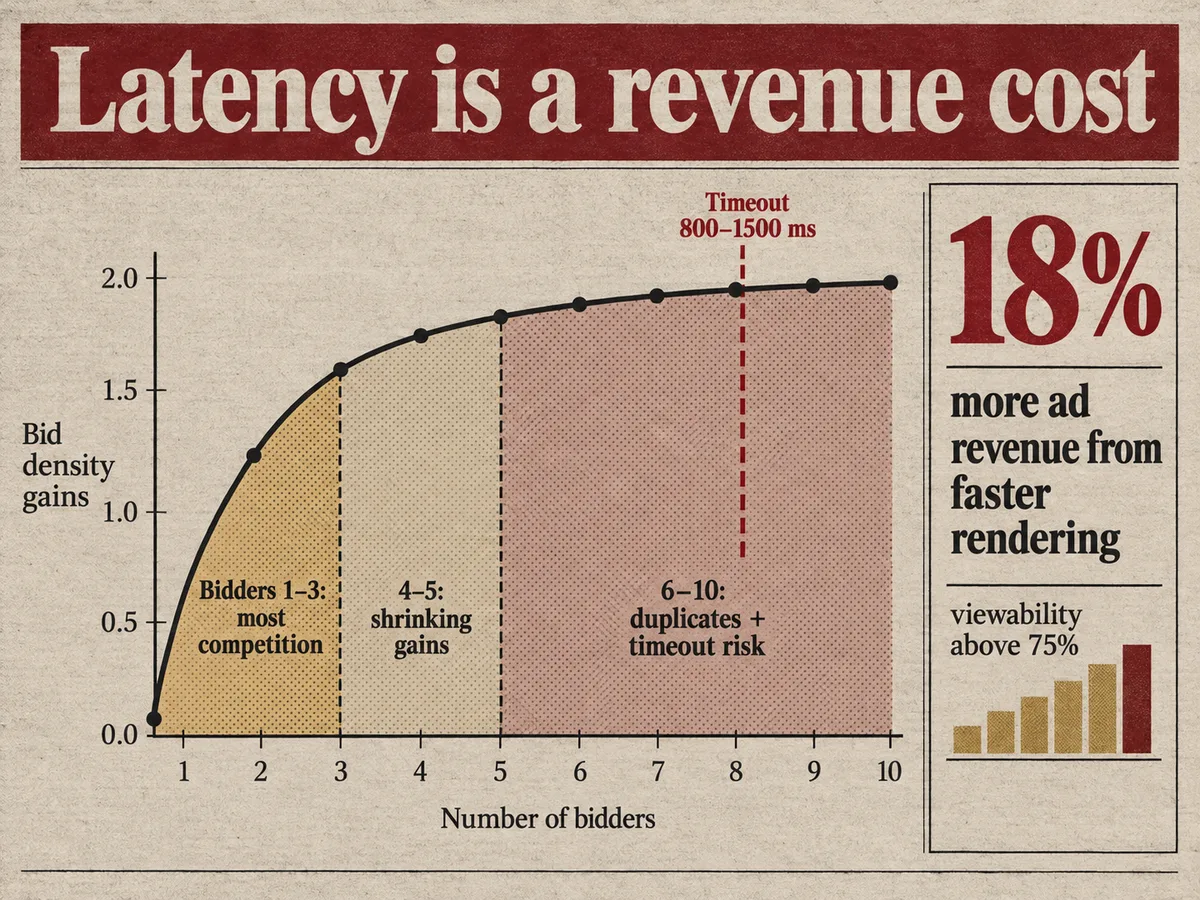
The compounding problem deserves emphasis: latency costs scale with partner count while bid density gains flatten. The first three bidders capture most of the auction competition. Bidders four and five add real but shrinking increments. Bidders six through ten mostly duplicate existing demand, add timeout risk and push render time toward the point where viewability and Core Web Vitals scores degrade. You pay a performance tax on every impression to win auctions you were already winning.
You cannot compare net CPMs across ten dashboards
Revenue attribution across many networks produces numbers that do not reconcile, and that gap hides real costs. Each network reports in its own currency, its own timezone and its own definition of a billable impression. Some report gross CPM before their cut, some report net. Some count served impressions, others count measured ones. Reconciliation discrepancies of 5 to 10 percent between a network's dashboard and Google Ad Manager are routine, and with ten partners you spend days per month chasing them.
The deeper problem is deduplication. When two networks both route the same advertiser budget through the same exchange, your wrapper counts two bidders but the advertiser counts one budget. The auction looks more competitive while the underlying demand has not grown. Only a supply path analysis on actual bid requests reveals the overlap, and most publishers running ten partners have never done one.
Payment terms distort comparisons further. A network reporting a 10 percent higher CPM on Net 90 terms with a 100 dollar minimum payout does not beat a partner paying Net 30 into your account every month. Cash timing, minimum thresholds that trap small balances and clawback policies for invalid traffic all sit outside the CPM column. When you cannot see true net revenue per partner per placement, you cannot make a rational decision about which partners to keep, so the stack grows by default.
ads.txt sprawl and the reseller tax
Every network you sign requires lines in your ads.txt file, and that file is where the supply chain starts to leak money. ads.txt prevents unauthorized reselling by enumerating authorized sellers, which makes it the first line of defense against counterfeit inventory. The mechanism works, but it also documents a cost most publishers never audit: each RESELLER line in your file marks a path where someone between you and the advertiser takes margin.
The scale of that margin is visible in bid requests. The schain reveals reseller fees mechanism, the SupplyChain object, exposes every reseller node in the bid request, so buyers can count the intermediaries between your page and their budget. Each node in that chain takes a cut, typically ranging from 10 to 30 percent of the transacted value. A bid that reaches you at 1.00 CPM after three reseller hops may have left the advertiser at 1.80. The advertiser's budget did not shrink, your cut did.
More partners mean more reseller paths, and the paths multiply faster than the partner count because networks themselves aggregate demand from other networks. A publisher with ten partners can easily present fifteen or more distinct supply paths to a single buyer, which invites the buyer to run supply path optimization and cut paths arbitrarily, sometimes cutting the one that paid you best.
Path quality also affects what demand you receive at all. Premium brands and their agencies increasingly buy against strict supply and content criteria, and they route budgets toward paths they can verify end to end. We hold direct deals from global and local brand agencies and combine them with Prebid, OpenRTB, Google MCM and Google AdX demand inside our SSP, which means those budgets bid on your inventory through a short, transparent path rather than through a chain of anonymous resellers. On the content side, our brand safety filtering keeps unwanted ads out, which protects the advertiser relationships that fund premium CPMs in the first place.
Operational overhead compounds per partner
Each network relationship carries fixed costs that never appear in a CPM report. Someone must negotiate the contract, track the payment terms, chase invoices and maintain the technical integration. Payment terms alone create real cost: we pay Net 30, but terms elsewhere in the market stretch to Net 60 or Net 90, and a publisher running eight networks on mixed terms manages eight separate cash-flow schedules. That is working capital sitting in other companies' accounts.
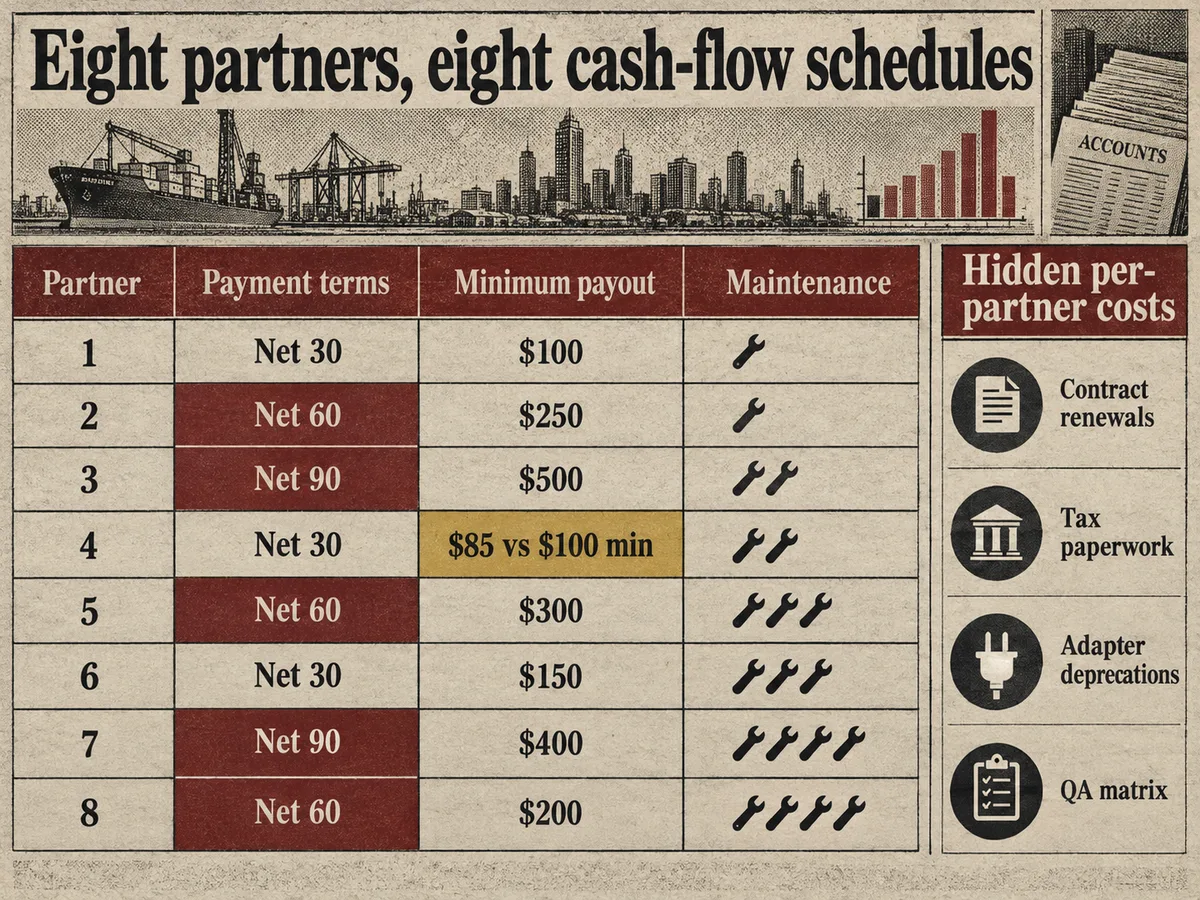
Minimum payout thresholds trap revenue outright. A partner paying 85 dollars against a 100 dollar minimum holds your money indefinitely, and small balances across six dormant networks can add up to a meaningful amount that never arrives. Add tax documentation, banking details, contact turnover at each vendor and quarterly reviews that nobody schedules, and the overhead consumes ad ops hours that would earn more spent on placement optimization.
Technical maintenance scales the same way. Prebid adapters get deprecated, bid parameters change, wrapper versions need coordinated updates and each new integration needs a QA cycle across devices and geographies. Every partner you add multiplies the test matrix. When an adapter breaks silently and starts returning no bids, a lean ad ops team with ten partners typically takes weeks to notice, and those weeks of zero bids from one bidder register only as a vague CPM dip.
Two to four partners, one per banner type
The setup we recommend, and the one we see perform best across our publisher base, is two to four network partners total, with each partner assigned to the banner types where it actually wins. One partner may dominate 300x250 display in your top geographies. Another may win video and CTV inventory consistently. A third may carry native formats or app inventory. The goal is coverage of formats and geographies with minimal overlap, not maximum partner count.
This structure works because competition in a header auction comes from demand density inside each partner, not from the number of partner logos. A partner that aggregates Prebid, OpenRTB, Google AdX demand through MCM and direct agency deals brings more distinct bids to a placement than four thin networks that all resell the same open exchange liquidity. Depth per banner type beats breadth of partner count, and it does so with a fraction of the latency and reporting overhead.
Our publisher monetization stack is built around exactly this consolidation: we combine open market demand, exchanges, DSPs and SSPs with direct deals from brand agencies so all of it bids against your ad spaces through one integration, one payment relationship and one reporting line. Publishers working globally across every country with Google monetization get the demand density of a large partner stack without the sprawl costs, and the strict filtering we apply keeps the ad quality consistent across all of it.
Four is a ceiling, not a target. If a fifth partner genuinely brings incremental demand for a format your current partners under-serve, test it properly: run it for a fixed period, measure net CPM per placement, check viewability and Core Web Vitals impact, and remove it if the numbers do not clear the bar. The discipline that matters is the willingness to remove, not the willingness to add.
How to consolidate without losing revenue
Start with a net revenue audit, not a CPM audit. For each partner, pull the last 90 days of actual payments, not dashboard estimates, and divide by the impressions Google Ad Manager attributed to that partner's line items. That single number, net revenue per attributed impression, cuts through gross-versus-net reporting games and currency noise. Rank partners per placement and per format, because a partner that wins video but loses display should keep video and lose display.
Next, cut the bottom of the ranking. Remove one partner at a time from the wrapper and hold everything else constant for a two-week window so you can observe fill, CPM and viewability without confounders. In most stacks we review, removing the bottom two or three partners moves net revenue by a small margin in either direction while measurably improving page speed and reporting clarity. Where removal does cost revenue on a specific format, replace that partner with one that specializes in that format rather than stacking a generalist on top.
Then shorten the supply path for the demand that matters most. Direct deals with brand agencies pay above open market rates and remove reseller margin entirely, and they reward publishers who can demonstrate clean inventory, verified sellers and fast pages. Our Direct Deals relationships exist for this reason: when brand budgets bid directly inside our SSP against your inventory, you capture the margin that reseller chains would otherwise take, and the advertiser gets a verifiable path from budget to impression.
Finally, put a review cadence in place so sprawl does not return. Re-run the net revenue ranking quarterly, audit your ads.txt file for lines that no longer correspond to active partners and check your SupplyChain data for paths that have grown new reseller nodes. Set a hard rule for new partners: they enter with a defined test window, a defined success metric and a defined removal date unless they earn their place.
The short version: partner count is a cost driver disguised as a revenue driver. Two to four partners, each owning the banner types where it genuinely wins, with short supply paths and direct demand layered on top, outperforms a nine-network wrapper on net revenue, page speed, viewability and the ad ops hours you get back. Fewer relationships, each held to a higher standard, is the setup that compounds.