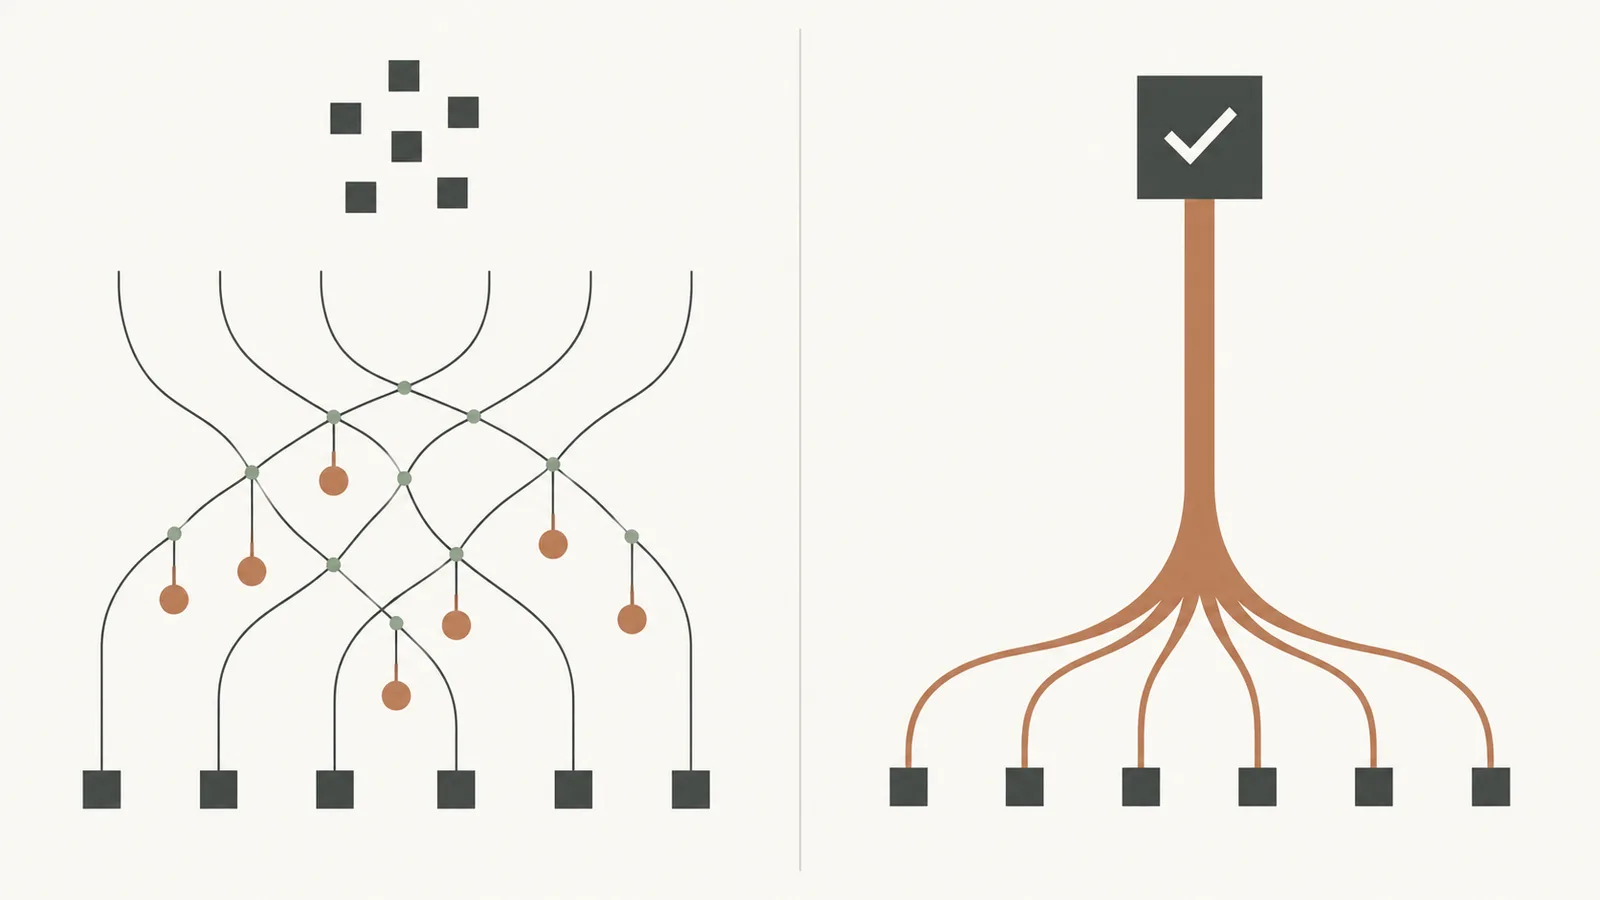

A site that serves 40 million ad requests per month and fills 60 percent of them leaves 16 million impressions unsold. At a $0.40 CPM, those impressions would have earned roughly $6,400 in a month, and they return zero instead. Fill rate is usually the first lever a publisher should pull, because unsold inventory earns nothing no matter how well the sold impressions perform. This guide walks the optimization path in the order we apply it with publishers: measurement, leak diagnosis, demand depth, auction architecture, timing, pricing, and rollout discipline. We use our own stack as the worked example, and every principle transfers to any configuration you run.
What fill rate actually measures
Fill rate divides delivered impressions by ad requests. Google defines total fill rate in Ad Manager as impressions divided by ad requests, and the same reporting set measures fill against programmatic eligible requests, which strips out calls that never entered a programmatic auction. You can read the exact definitions in the Ad Manager fill rate metrics table. The distinction matters because your ad server may report 90 percent total fill while programmatic fill sits far lower, and the gap usually contains fallback ads and requests your own setup disqualified.
Two numbers should sit next to fill rate in every dashboard: average CPM and revenue per thousand requests. A stack can fill 100 percent of impressions at a $0.02 CPM and earn less than a stack filling 70 percent at $0.40. Optimize the product of fill and CPM, not fill alone, and treat any fill rate change as suspect until you confirm that revenue moved in the same direction.
Set a baseline before you change anything. Export 30 days of requests, impressions, and revenue by ad unit, geo, device, and demand source. Without that baseline you cannot attribute a fill rate gain to the change that caused it, and you will re-argue the same question with your team every quarter.
Where impressions leak before the auction starts
Most unfilled impressions never reach a buyer at all. They die in the plumbing between the browser and the auction, and no demand-side change will recover them. Audit these failure points in order, because each one sits downstream of the last:
- Consent signals: a missing or malformed TCF consent string causes most compliant buyers to suppress bids. Global Privacy Control signals need explicit handling too, or you lose the same impressions in privacy-forward geos.
- Size mismatches: an ad unit that requests sizes buyers rarely transact in, or omits sizes they do transact in, fills at a lower rate by construction.
- Timeout losses: bids that arrive after the auction closes count as no-bids in your reports even though the buyer wanted the impression.
- Geo and vertical gaps: a demand source with strong US retail coverage may return nothing for a reader in a long-tail market or a niche vertical.
- Filtering: strict category filtering removes demand deliberately. We filter aggressively because a clean ad pool protects brand trust and long-term CPMs, but you should know the volume you give up.
- Fallback behavior: unfilled impressions that render fallback or house creative still consume the request and depress your programmatic fill rate.
Quantify each leak. Pull no-bid reasons from your ad server reports, tag consent failures separately, and measure how many requests your current stack disqualifies before the auction opens. Publishers typically find that 10 to 20 percent of requests never see a bid, and that share responds to configuration work faster than CPM does.
Demand depth sets your fill rate ceiling
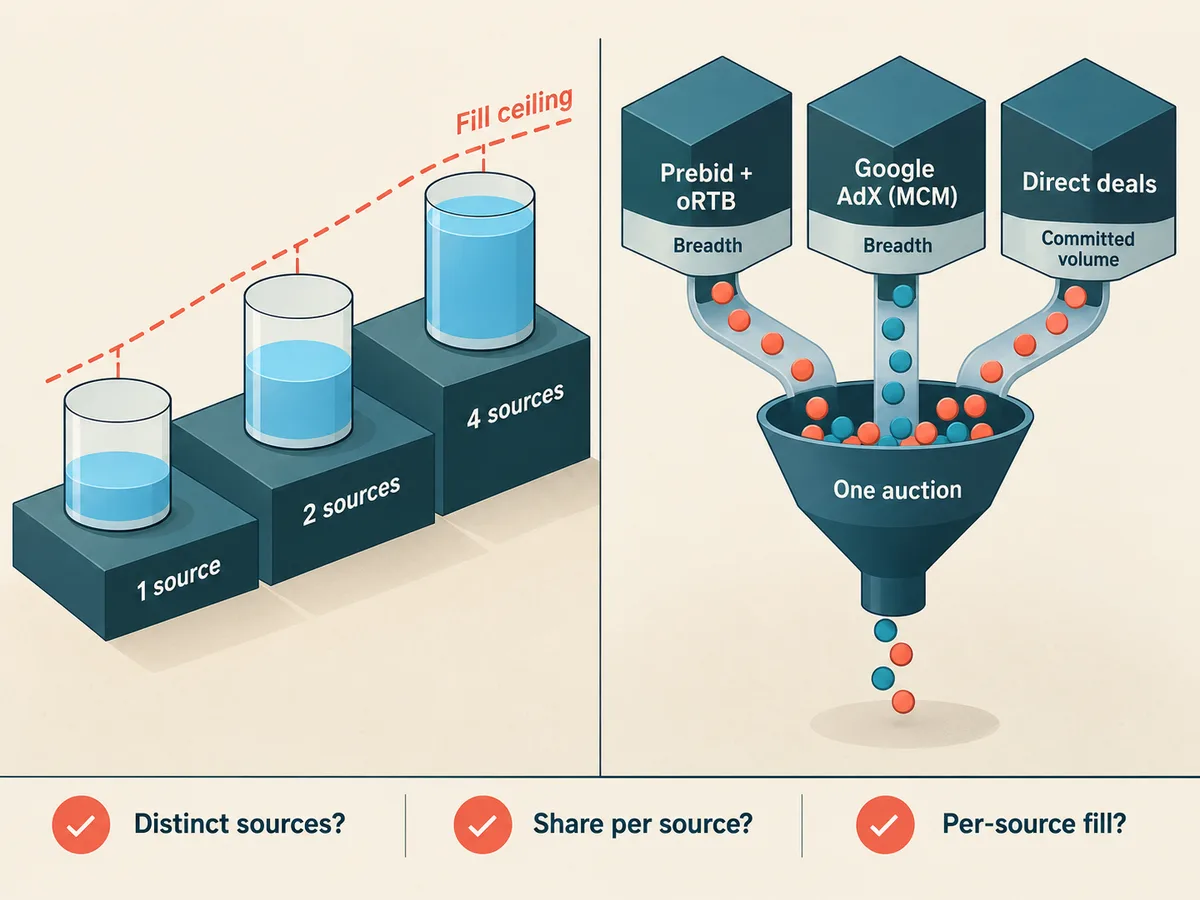
A single demand source has a hard fill ceiling: whatever share of impressions it can buy, it buys, and the rest goes unfilled. Two sources bidding on the same impression raise the probability that at least one bids, and the effect compounds as you add genuinely distinct demand. Depth of demand, not the reputation of any one partner, is what moves fill rate at the portfolio level.
We build our stack the way we recommend every publisher build one. We combine Prebid, OpenRTB, Google MCM with Google Ad Exchange demand, and direct deals from global and local brand agencies, and we push all of it into our SSP platform so every source competes on the same ad spaces. Open market exchanges and DSPs provide breadth, direct deals provide committed volume at negotiated rates, and the combination bids highest on each impression because the auction sees all demand at once.
Our ad sources hold premium quality standards for brands, and we filter unwanted ads strictly. That filtering removes some fill, and we accept the trade because low-quality ads depress engagement and repeat visits more than the lost impressions cost. We work globally, in every country where Google monetization operates, across web, app, and CTV/OTT. That coverage matters for fill, because a stack tuned only for US desktop traffic will strand inventory everywhere else.
When you evaluate a stack, ask three questions. How many distinct demand sources bid on each impression? What share of your traffic can each source actually buy? Does the stack expose per-source fill so you can see which partner carries which impressions? A stack that answers all three gives you the raw material for optimization, and a stack that answers none of them leaves you guessing.
Client-side header bidding and bid density
Client-side header bidding runs the auction in the browser before the ad server call. Prebid.js collects bids from multiple demand partners simultaneously, and client-side header bidding competition raises bid density per impression: more bids per slot means a higher probability that at least one clears your floor. Our guide to header bidding setup covers the tag-level implementation, so here we focus on the configuration choices that decide fill.
Adapter count cuts both ways. Each adapter adds another auction participant and another network call, and your slowest partner sets the timeout budget. Start with the partners that actually transact in your geos and verticals, drop adapters that bid rarely, and re-test quarterly. Most publishers run well with four to ten active client-side adapters, and the right number depends on your traffic mix.
Wire the details that quietly gate bids. Size mapping should request the sizes buyers actually purchase at each breakpoint. Consent passthrough should deliver the TCF string to every adapter. First-party data should reach the auction as key-values where you have it. Cached bids should serve refresh scenarios, because a refresh without a fresh auction fills nothing.
Server-side bidding moves the auction off the page
Server-side bidding moves the auction to a server, and the browser only renders the winner. Prebid Server and Google Open Bidding both work this way, and Open Bidding for higher yield lets partners optimize yield management on your inventory because they see the request server-side and apply their own decisioning without the browser round trip. The trade is transparency: you lose some visibility into individual partner bids unless your stack reports them back.
Server-side demand suits two cases especially well. Slow partners that chronically miss a client-side timeout perform better server-side, and app and CTV/OTT environments, where latency budgets are tight and VAST-based video demand transacts server-side, benefit from the architecture. Hybrid stacks work well in practice: keep the fastest, most transparent partners client-side and push the rest server-side.
Authorization files decide whether buyers trust your supply. Keep ads.txt current on every subdomain, app-ads.txt in every app listing, and a complete sellers.json with a valid SupplyChain object so Authorized Buyers and other buyers can verify that you authorize each reseller. Broken authorization files suppress bids silently, and buyers rarely tell you why.
Timeouts and auction timing cap fill quietly
Your auction timeout sets how long the page waits for bids, and it interacts with fill rate in both directions. A short timeout closes the auction before slow partners respond, so their demand disappears from your reports. A long timeout waits for everyone, and the page renders later, which costs viewability, engagement, and sometimes the user entirely.
Typical client-side Prebid configurations land between 800 and 1500 milliseconds, and Google Ad Manager adds a separate auction delay setting for Open Bidding partners, often in the 300 to 500 millisecond range. Neither number is universal. Measure revenue per session, not revenue per impression, when you tune them, because a timeout that lifts fill by three points but costs six points of viewability usually loses money.
Lazy loading and refresh deserve the same discipline. Load below-the-fold units as they approach the viewport, and refresh on intervals that hand buyers a fresh, viewable impression, commonly 30 to 60 seconds. Refresh without viewability fills impressions that buyers learn to discount, and the CPM penalty typically arrives within weeks.
Floor prices trade fill for CPM on purpose
Floor prices decide which bids count. Set floors too low and you sell impressions to the first bidder that clears them; set them too high and buyers walk, and fill drops. The revenue-maximizing floor sits where the CPM gain on filled impressions outweighs the impressions you lose, and that point differs by ad unit, geo, and format.
Run the arithmetic on your own numbers with our CPM calculator before you change anything. Ten million impressions at a $0.30 CPM earn $3,000, while eight million at $0.40 earn $3,200, so in that illustration the fill loss pays. Reverse the numbers and the same fill loss destroys revenue, which is why floor changes need testing rather than conviction.
Dynamic floors beat static ones once you have data. Let the stack observe clearing prices per ad unit and geo, raise floors where bids consistently clear them, and lower floors where fill drops without a CPM gain. Review monthly, because buyer behavior shifts with seasonality and budget cycles, and a floor that maximized revenue in Q4 rarely still does in February.
Ad unit and page configuration still matter
Fill rate lives and dies in details that no demand partner will fix for you. Request the sizes buyers actually transact in your geos, and retire sizes that never fill. Keep ad units in the viewport long enough to accumulate bids. Avoid stacking multiple auction layers on one placement, because each layer adds a timeout and another chance to lose the impression.
Ad density per page interacts with bid quality. Ten units per page splits buyer budget across ten auctions, and buyers concentrate spend on the placements that perform, so the marginal unit often fills at a fraction of the first unit's CPM. Test placement count the way you test everything else: one variable, a traffic slice, a control group.
Refresh policies, interstitial frequency, and format mix all move fill and CPM in different directions. Publishers who ship five changes in one release cannot tell which one worked, and they usually roll back the wrong one. Hold a control slice for every test, and give CTV/OTT and app inventory with lower volume a longer test window than web display.
Measurement closes the loop
Optimization without attribution is guesswork. You need per-ad-unit, per-geo, per-device, and per-demand-source reporting on requests, impressions, fill rate, and CPM, and you need it granular enough to catch regressions within days rather than at month end. Our revenue analytics layer exists for exactly this: we surface the auction internals, not just the invoice totals, so you can see which partner fills which impressions and at what price.
Watch for cannibalization as you add demand. A new partner that wins impressions your existing partners would have bought at a higher price adds nothing, and only per-source reporting exposes it. Compare clearing CPMs across sources monthly, prune the losers, and re-test the pruned ones quarterly, because demand quality drifts.
Payment terms affect how fast you can act on what the data tells you. We pay Net 30, which keeps your cash cycle short enough that you can test aggressively without financing the experiments yourself. Slow terms compound the cost of a bad quarter, because you learn about the regression and then wait for the money anyway.
Rolling out the stack without breaking revenue
Sequence the work so each change stays attributable. Baseline first, then fix leaks in consent, sizes, and authorization files, then restructure demand depth, then tune timing and floors, and only then chase incremental partners. Reversing that order means every later change sits on top of an unmeasured foundation.
Run changes in parallel where the architecture allows it. Split traffic by ad unit or by geo, hold a control slice, and compare fill and revenue per thousand requests across the split. A two-week window handles most web changes, and lower-volume app or CTV inventory may need longer.
When you migrate stacks, keep the old one running on the control slice until the new one wins on revenue per thousand requests, not on fill rate alone. We onboard publishers this way: the MCM and AdX relationships move over in stages, and direct deals layer in last, because direct deals carry contractual impressions and you do not want a migration week to miss them.
Fill rate optimization is a sequence of measurable trades: demand depth for auction coverage, timeout for viewability, floors for CPM, filtering for trust. None of them is free, all of them are testable, and the publishers who win are the ones who keep the attribution loop running while they make each trade.