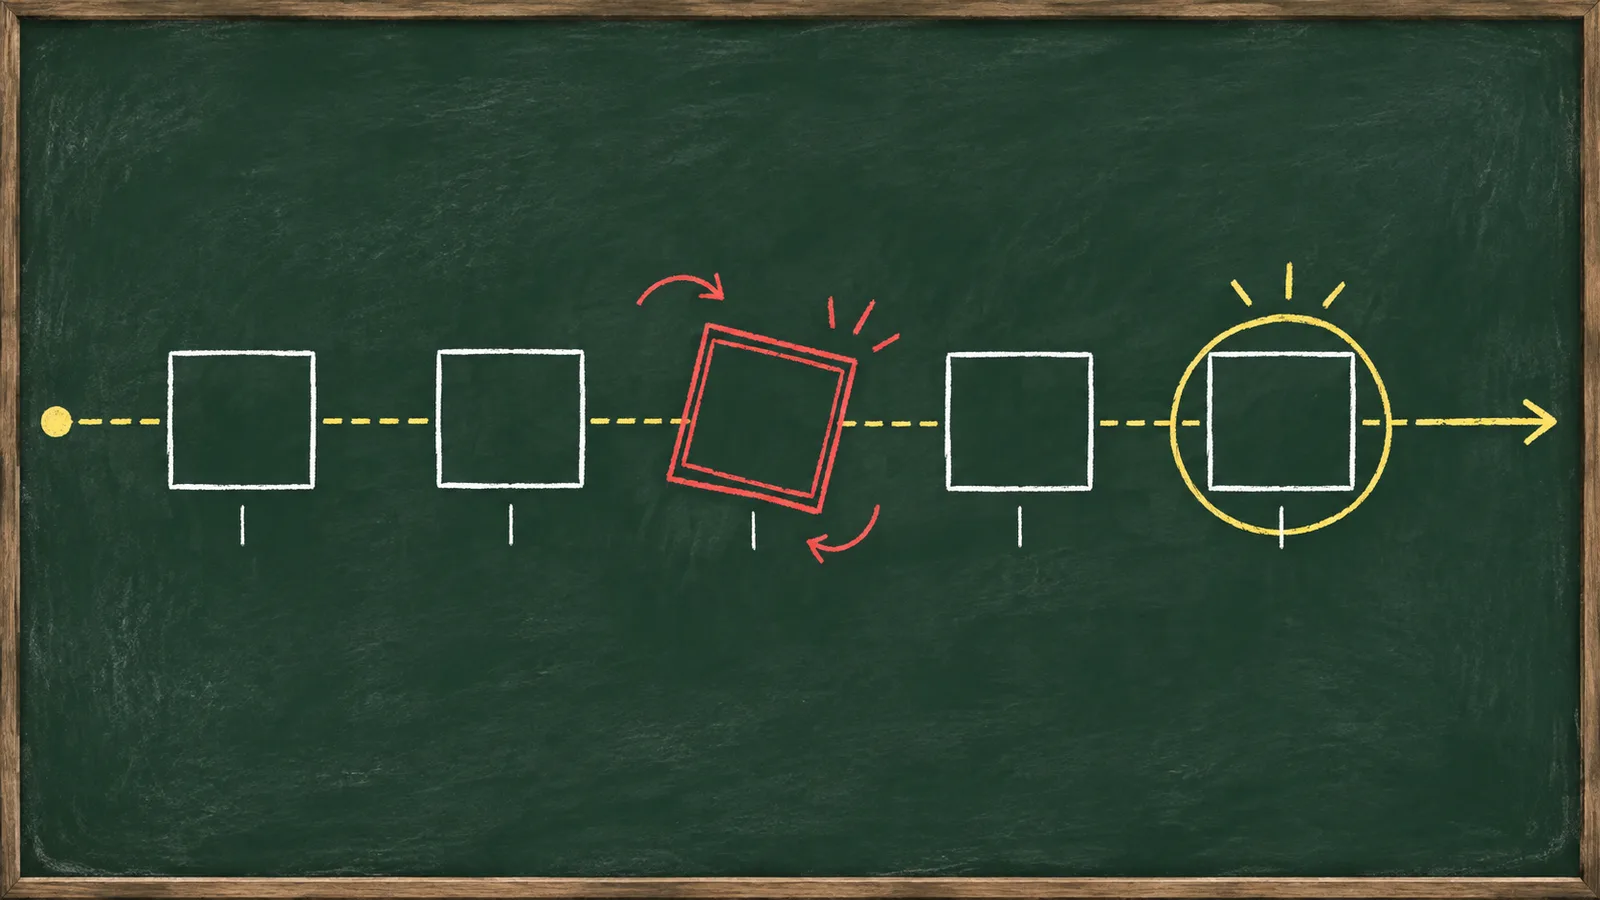

Most header bidding setups we audit run between eight and twenty Prebid adapters, and in more than half of those setups at least one adapter has not won a single impression in thirty days. The instinct behind the number is sound: more bidders should mean more bids per auction and higher clearing prices. The mechanism stops working at a predictable point. Every adapter you add charges you in milliseconds, page weight and maintenance, while the incremental demand it brings shrinks as it overlaps with demand you already have. The question is not whether adapters add value. The question is where the marginal value of adapter N falls below its marginal cost, and how to find that point in your own auction data.
Bid density is a mechanism, not a scoreboard
Bid density means the average number of valid bids your header auction receives per impression request. Its close cousin, bid coverage, measures the share of auctions that receive at least one bid at all. Both numbers matter because of how the header auction clears: Prebid.js collects bids, ranks them, and pushes the top price into Google Ad Manager as a line item, where it competes against AdX and direct deals. A denser auction raises the price floor that AdX demand has to beat, and a higher coverage rate means fewer impressions fall through to low-value backfill.
The mechanism only rewards unique demand, and this is where most publishers misread the metric. An auction with twelve bids from five buyers is denser on paper than an auction with eight bids from eight buyers, but the twelve-bid auction carries duplicate supply paths, and duplicates do not raise clearing prices. What actually lifts revenue is the number of distinct buyers competing, not the raw count of bid responses. When we review a setup, we look past density totals and ask which adapters contribute demand that no other adapter already brings to the auction.
Every adapter charges three prices
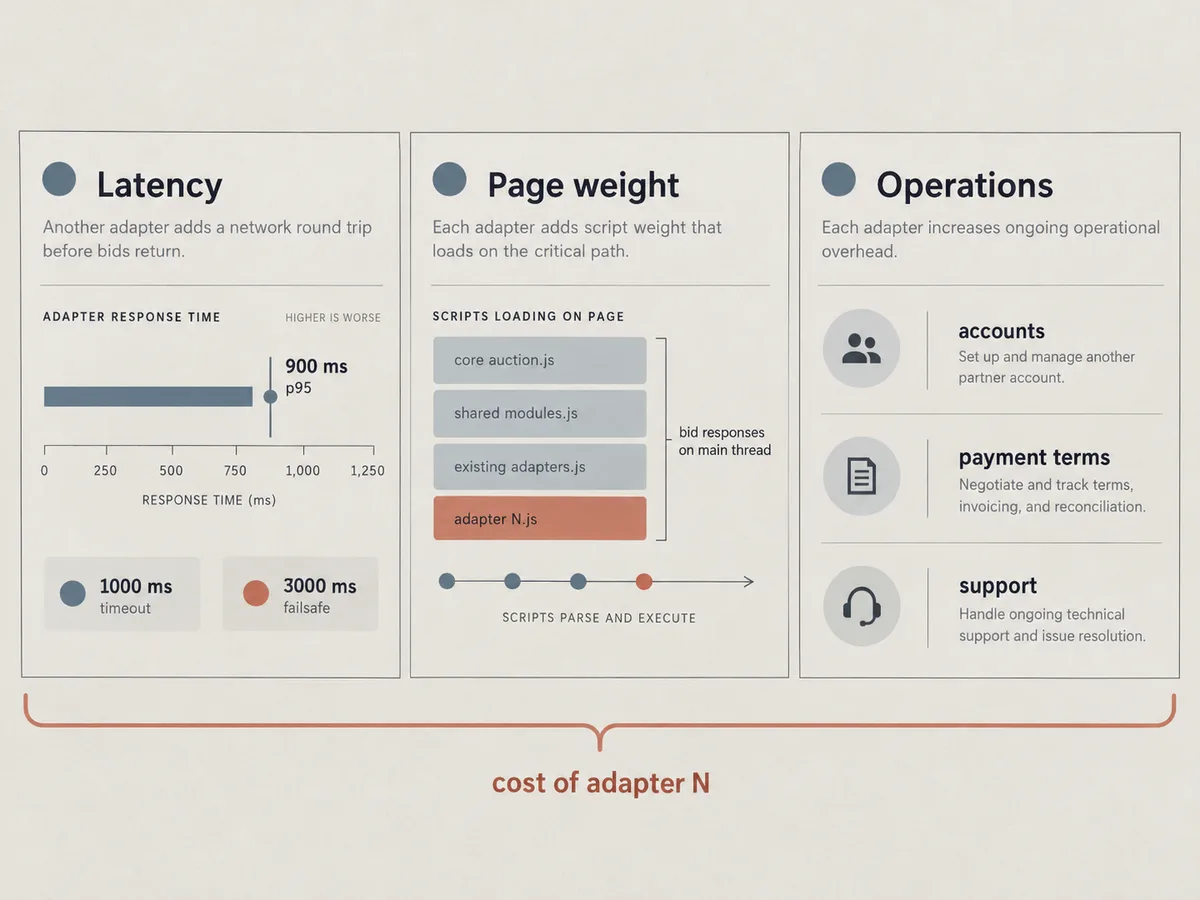
The first price is latency. Each adapter fires a request at auction start, and the auction cannot close until the slowest bidder responds or the timeout expires. A single adapter with a p95 time-to-bid of 900 milliseconds holds every auction it participates in hostage to its own performance, and the penalty lands on every impression on the page, not just the ones that adapter wins. The Prebid project's own guidance on how many bidders to use suggests one to five client-side partners with a 1000ms auction timeout and a 3000ms failsafe timeout, and that range reflects exactly this arithmetic.
The second price is page weight. Every adapter adds JavaScript to the wrapper, and that code downloads, parses and executes on the main thread before, during and after each auction. Bid responses themselves add work: JSON parsing, key-value formatting and GAM line item matching all run on the same thread that renders your content. The third price is operational. Each adapter carries its own account setup, payment terms, reporting quirks and support channel, and someone on your team pays for that overhead in hours every month.
The main-thread cost deserves special attention because it hits metrics outside the auction itself. Long, synchronous JavaScript tasks block rendering and input handling, and Google's guidance on breaking up long JavaScript tasks is direct on the point: heavy tasks make the page feel unresponsive, and splitting them restores interactivity. A wrapper with fifteen adapters processing bid responses in one burst produces exactly the kind of long task that drags Interaction to Next Paint down, which in turn feeds your Core Web Vitals, which in turn affects how search and demand partners treat the page. Latency is not an abstract tax. It compounds through every downstream system.
Demand overlap drives the diminishing returns
If every adapter brought a distinct pool of buyers, more adapters would always mean more revenue. They do not. A large share of programmatic demand flows through a small number of underlying buyers, and multiple exchanges and supply-side platforms resell access to the same buyers through different supply paths. When you connect two adapters that both reach the same buyer, that buyer now bids twice through two routes, and the second path adds bid count without adding a new competitor.
You can see this directly in your own setup. The SupplyChain object, which Prebid passes with each bid request, records the chain of sellers an impression travels through, and sellers.json exposes who actually controls each seat. Audit a few winning impressions and you will often find the same buyer appearing through three different adapters at three different price points, because each intermediary takes its own margin along the way. The publisher pays that margin stack in reduced net CPMs.
The overlap problem also explains why the returns curve bends so early. The first two or three major adapters typically capture the bulk of available open-market demand. Adapter five adds a fraction of what adapter two added. Adapter twelve adds something close to nothing, because the demand it reaches already bid through four other routes. Meanwhile the fixed costs, latency, weight and maintenance, stay constant per adapter no matter how little it contributes. Diminishing returns are not a soft trend here. They are arithmetic.
How to find the knee in your own data
The knee is the point on your cumulative revenue curve where each additional adapter adds less net revenue than it costs in latency and operations. You find it with per-adapter measurement, not with industry benchmarks, because your audience, geo mix and inventory format determine where the curve bends for you. Pull the following numbers per adapter over a rolling thirty-day window:
- Bid rate: the share of auctions in which the adapter returned a valid bid at all.
- Win rate: the share of auctions in which the adapter's bid topped the header auction.
- Net revenue eCPM: revenue after fees and discrepancies, divided by impressions.
- Time-to-bid at p95, not the average, because the slow tail is what sets your timeout.
- Render rate: how many won impressions actually rendered, which exposes discrepancies.
Our analytics reporting breaks these numbers out per demand source, and the pattern it shows is consistent across publishers: a small number of adapters produce the large majority of net revenue, a middle tier contributes marginally, and a long tail contributes bids that never win. Sort your adapters by net revenue contribution and plot the cumulative total. The knee sits where the curve visibly flattens, and for most setups it lands far below the adapter count currently installed.
Then confirm with a holdout, because correlation in reporting is not causation in the auction. Remove the bottom one or two adapters for a full week, long enough to smooth day-of-week effects, and watch three things: total net revenue, page latency, and viewability. A well-chosen removal shows flat or better revenue with measurably faster auctions. A poorly chosen one shows a revenue drop that tells you the adapter carried unique demand the reporting underweighted. Run one holdout at a time so the effect stays attributable.
Server-side paths change the count, not the principle
Moving adapters server-side relieves the browser of some weight, but it does not repeal the economics. With Prebid Server, the page talks to a single endpoint, and the server fans out requests to demand partners and returns consolidated bids. The documented Prebid Server use cases concentrate on environments where a client-side wrapper cannot run at all: AMP pages, long-form video, and app inventory. For those formats the server-side path is the only practical option, and it performs well there.
What server-side does not do is make forty bidders free. The server still enforces a timeout, so slow demand partners still delay the auction, just in a data center instead of the user's browser. Demand overlap persists, because the same buyers sit behind the same server-side connections. And server-side hops insert an intermediary between you and the buyer, which matters for transparency: you should always know the full supply chain your impressions travel through, and you should verify that your server-side partners pass a complete SupplyChain object rather than truncating it. The right question shifts from how many client-side adapters fit in your timeout to how much unique demand each connection brings, client-side or server-side, and the answer follows the same curve.
One connection instead of forty adapters
The logical endpoint of the diminishing-returns problem is not a better-managed long tail of adapters. It is consolidation of the demand layer itself. That is the model we run at WireAds. We connect once to the demand sources that matter: Prebid-based demand, OpenRTB connections, Google MCM with AdX access, and direct deals from global and local brand agencies, all pushed into a single auction inside WireAds SSP. The publisher integrates one connection, and we carry the adapter management, the timeout tuning and the demand-quality filtering on our side.
This structure changes the publisher's cost equation in a specific way. You stop paying the per-adapter latency and maintenance tax, because there is no adapter sprawl on your page to maintain. You keep the competitive density, because our demand stack still puts multiple buyers into every auction, and the direct agency deals we hold bring brand campaigns that open-market adapters rarely surface. We work on a CPM basis and pay Net 30, and we apply strict filtering to keep low-quality and unwanted creatives out of the inventory, across web, app and CTV/OTT, in every country where Google monetization operates. The adapter-count question does not disappear under this model. We answer it continuously on our side, so that the marginal demand source we add always clears the bar of contributing more than it costs.
A quarterly adapter audit keeps the curve honest
The knee moves over time. Demand partners change their buyer pools, new formats shift where the money is, and an adapter that contributed unique demand in January may duplicate another adapter's demand by June. Treat your adapter configuration as a living system and audit it on a fixed schedule rather than when revenue dips. A workable quarterly routine:
- Export per-adapter bid rate, win rate, net eCPM and p95 time-to-bid for the trailing ninety days.
- Cross-check winning impressions against the SupplyChain object and sellers.json to flag duplicated supply paths.
- Hold out the bottom adapter for one week and measure revenue, latency and viewability against the prior week.
- Review your timeout configuration against actual time-to-bid distributions, and cut the timeout below the point where bids stop arriving.
- Test at most one new demand source per quarter, with a removal criterion defined before the test starts.
The discipline in step five matters most. Every publisher we work with can name an adapter that entered the wrapper during a revenue panic and never left, long after it stopped earning its slot. Define the exit condition before the entry.
The practical answer to the title question is a range, not a number. Below roughly three well-chosen client-side connections you leave unique demand on the table. Beyond roughly eight you are almost certainly paying more in latency, weight and overhead than the marginal bids return, and the audit data will show it. Find your own knee with per-adapter numbers and holdout tests, or collapse the question entirely by letting a single supply-side connection carry the demand stack for you. Either way, stop counting adapters and start counting what each one uniquely contributes.